


Notebooks

Categories


Cells
Premium


BioTuring
Power analyses are considered important factors in designing high-quality experiments. However, such analyses remain a challenge in single-cell RNA-seq studies due to the presence of hierarchical structure within the data (Zimmerman et al., 2021). As cells sampled from the same individual share genetic and environmental backgrounds, these cells are more correlated than cells sampled from different individuals. Currently, most power analyses and hypothesis tests (e.g., differential expression) in scRNA-seq data treat cells as if they were independent, thus ignoring the intra-sample correlation, which could lead to incorrect inferences.
Hierarchicell (Zimmerman, K.D. and Langefeld, C.D., 2021) is an R package proposed to estimate power for testing hypotheses of differential expression in scRNA-seq data while considering the hierarchical correlation structure that exists in the data. The method offers four important categories of functions: data loading and cleaning, empirical estimation of distributions, simulating expression data, and computing type 1 error or power.
In this notebook, we will illustrate an example workflow of Hierarchicell. The notebook is inspired by Hierarchicell's vignette and modified to demonstrate how the tool works on BioTuring's platform.

BioTuring
Computational methods that model how the gene expression of a cell is influenced by interacting cells are lacking.
We present NicheNet, a method that predicts ligand–target links between interacting cells by combining their expression data with prior knowledge of signaling and gene regulatory networks.
We applied NicheNet to the tumor and immune cell microenvironment data and demonstrated that NicheNet can infer active ligands and their gene regulatory effects on interacting cells.

BioTuring
Understanding global communications among cells requires accurate representation of cell-cell signaling links and effective systems-level analyses of those links.
We construct a database of interactions among ligands, receptors and their cofactors that accurately represent known heteromeric molecular complexes. We then develop **CellChat**, a tool that is able to quantitatively infer and analyze intercellular communication networks from single-cell RNA-sequencing (scRNA-seq) data.
CellChat predicts major signaling inputs and outputs for cells and how those cells and signals coordinate for functions using network analysis and pattern recognition approaches. Through manifold learning and quantitative contrasts, CellChat classifies signaling pathways and delineates conserved and context-specific pathways across different datasets.
Applying **CellChat** to mouse and human skin datasets shows its ability to extract complex signaling patterns.

BioTuring
Single-cell RNA sequencing (scRNA-seq) protocols often face challenges in measuring the expression of all genes within a cell due to various factors, such as technical noise, the sensitivity of scRNA-seq techniques, or sample quality. This limitation gives rise to a need for the prediction of unmeasured gene expression values (also known as dropout imputation) from scRNA-seq data.
ADImpute (Leote A, 2023) is an R package combining several dropout imputation methods, including two existing methods (DrImpute, SAVER), two novel implementations: Network, a gene regulatory network-based approach using gene-gene relationships learned from external data, and Baseline, a method corresponding to a sample-wide average..
This notebook is to illustrate an example workflow of ADImpute on sample datasets loaded from the package. The notebook content is inspired from ADImpute's vignette and modified to demonstrate how the tool works on BioTuring's platform.
Trends
BioTuring
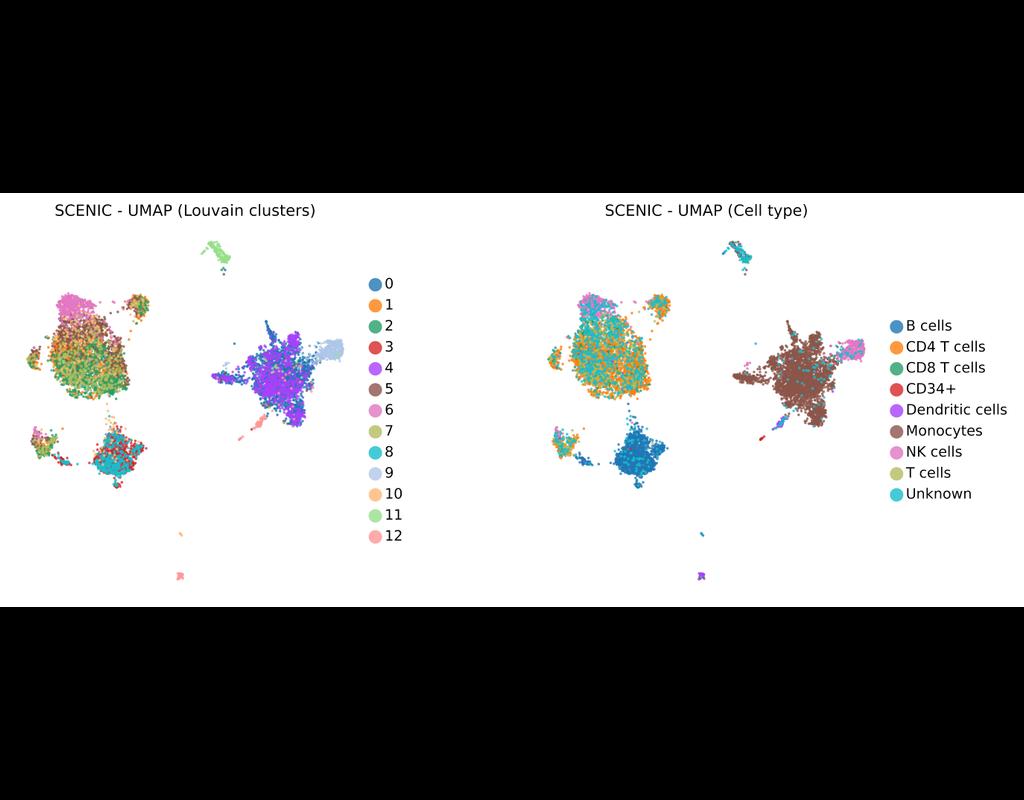
SCENIC Suite is a set of tools to study and decipher gene regulation. Its core is based on SCENIC (Single-Cell Regulatory Network Inference and Clustering) which enables you to infer transcription factors, gene regulatory networks and cell types from single-cell RNA-seq data.
pySCENIC is a lightning-fast python implementation of the SCENIC pipeline (Single-Cell Regulatory Network Inference and Clustering) which enables biologists to infer transcription factors, gene regulatory networks and cell types from single-cell RNA-seq data.