


Notebooks

Categories


Cells
Notebook
Premium


BioTuring
Power analyses are considered important factors in designing high-quality experiments. However, such analyses remain a challenge in single-cell RNA-seq studies due to the presence of hierarchical structure within the data (Zimmerman et al., 2021). As cells sampled from the same individual share genetic and environmental backgrounds, these cells are more correlated than cells sampled from different individuals. Currently, most power analyses and hypothesis tests (e.g., differential expression) in scRNA-seq data treat cells as if they were independent, thus ignoring the intra-sample correlation, which could lead to incorrect inferences.
Hierarchicell (Zimmerman, K.D. and Langefeld, C.D., 2021) is an R package proposed to estimate power for testing hypotheses of differential expression in scRNA-seq data while considering the hierarchical correlation structure that exists in the data. The method offers four important categories of functions: data loading and cleaning, empirical estimation of distributions, simulating expression data, and computing type 1 error or power.
In this notebook, we will illustrate an example workflow of Hierarchicell. The notebook is inspired by Hierarchicell's vignette and modified to demonstrate how the tool works on BioTuring's platform.

BioTuring
Spatially resolved gene expression profiles are key to understand tissue organization and function. However, spatial transcriptomics (ST) profiling techniques lack single-cell resolution and require a combination with single-cell RNA sequencing (scRNA-seq) information to deconvolute the spatially indexed datasets.
Leveraging the strengths of both data types, we developed SPOTlight, a computational tool that enables the integration of ST with scRNA-seq data to infer the location of cell types and states within a complex tissue. SPOTlight is centered around a seeded non-negative matrix factorization (NMF) regression, initialized using cell-type marker genes and non-negative least squares (NNLS) to subsequently deconvolute ST capture locations (spots).
Simulating varying reference quantities and qualities, we confirmed high prediction accuracy also with shallowly sequenced or small-sized scRNA-seq reference datasets. SPOTlight deconvolution of the mouse brain correctly mapped subtle neuronal cell states of the cortical layers and the defined architecture of the hippocampus. In human pancreatic cancer, we successfully segmented patient sections and further fine-mapped normal and neoplastic cell states.
Trained on an external single-cell pancreatic tumor references, we further charted the localization of clinical-relevant and tumor-specific immune cell states, an illustrative example of its flexible application spectrum and future potential in digital pathology.
BioTuring
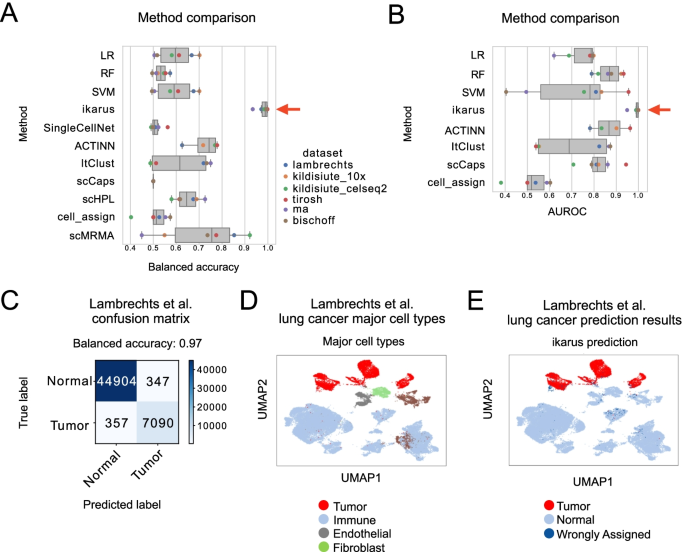
Tumors are complex tissues of cancerous cells surrounded by a heterogeneous cellular microenvironment with which they interact. Single-cell sequencing enables molecular characterization of single cells within the tumor. However, cell annotation—the assignment of cell type or cell state to each sequenced cell—is a challenge, especially identifying tumor cells within single-cell or spatial sequencing experiments.
Here, we propose ikarus, a machine learning pipeline aimed at distinguishing tumor cells from normal cells at the single-cell level. We test ikarus on multiple single-cell datasets, showing that it achieves high sensitivity and specificity in multiple experimental contexts.
**InferCNV** is a Bayesian method, which agglomerates the expression signal of genomically adjointed genes to ascertain whether there is a gain or loss of a certain larger genomic segment. We have used **inferCNV** to call copy number variations in all samples used in the manuscript.
BioTuring
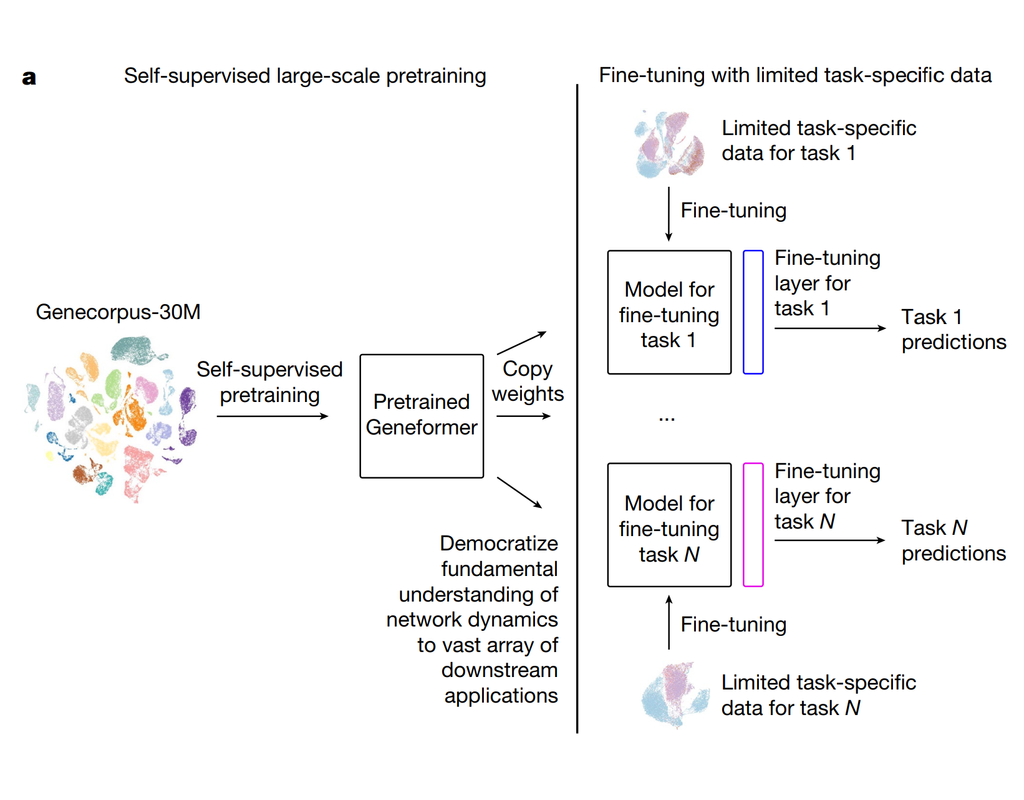
Geneformer is a foundation transformer model pretrained on a large-scale corpus of ~30 million single cell transcriptomes to enable context-aware predictions in settings with limited data in network biology. Here, we will demonstrate a basic workflow to work with ***Geneformer*** models.
These notebooks include the instruction to:
1. Prepare input datasets
2. Finetune Geneformer model to perform specific task
3. Using finetuning models for cell classification and gene classification application