


Notebooks

Categories


Cells
Premium


BioTuring
Power analyses are considered important factors in designing high-quality experiments. However, such analyses remain a challenge in single-cell RNA-seq studies due to the presence of hierarchical structure within the data (Zimmerman et al., 2021). As cells sampled from the same individual share genetic and environmental backgrounds, these cells are more correlated than cells sampled from different individuals. Currently, most power analyses and hypothesis tests (e.g., differential expression) in scRNA-seq data treat cells as if they were independent, thus ignoring the intra-sample correlation, which could lead to incorrect inferences.
Hierarchicell (Zimmerman, K.D. and Langefeld, C.D., 2021) is an R package proposed to estimate power for testing hypotheses of differential expression in scRNA-seq data while considering the hierarchical correlation structure that exists in the data. The method offers four important categories of functions: data loading and cleaning, empirical estimation of distributions, simulating expression data, and computing type 1 error or power.
In this notebook, we will illustrate an example workflow of Hierarchicell. The notebook is inspired by Hierarchicell's vignette and modified to demonstrate how the tool works on BioTuring's platform.

BioTuring
CellRank2 (Weiler et al, 2023) is a powerful framework for studying cellular fate using single-cell RNA sequencing data. It can handle millions of cells and different data types efficiently. This tool can identify cell fate and probabilities across various data sets. It also allows for analyzing transitions over time and uncovering key genes in developmental processes. Additionally, CellRank2 estimates cell-specific transcription and degradation rates, aiding in understanding differentiation trajectories and regulatory mechanisms.
In this notebook, we will use a primary tumor sample of patient T71 from the dataset GSE137804 (Dong R. et al, 2020) as an example. We have performed RNA-velocity analysis and pseudotime calculation on this dataset in scVelo (Bergen et al, 2020) notebook. The output will be then loaded into this CellRank2 notebook for further analysis.
This notebook is based on the tutorial provided on CellRank2 documentation. We have modified the notebook and changed the input data to show how the tool works on BioTuring's platform.

BioTuring
Build single-cell trajectories with the software that introduced **pseudotime**. Find out about cell fate decisions and the genes regulated as they're made.
Group and classify your cells based on gene expression. Identify new cell types and states and the genes that distinguish them.
Find genes that vary between cell types and states, over trajectories, or in response to perturbations using statistically robust, flexible differential analysis.
In development, disease, and throughout life, cells transition from one state to another. Monocle introduced the concept of **pseudotime**, which is a measure of how far a cell has moved through biological progress.
Many researchers are using single-cell RNA-Seq to discover new cell types. Monocle 3 can help you purify them or characterize them further by identifying key marker genes that you can use in follow-up experiments such as immunofluorescence or flow sorting.
**Single-cell trajectory analysis** shows how cells choose between one of several possible end states. The new reconstruction algorithms introduced in Monocle 3 can robustly reveal branching trajectories, along with the genes that cells use to navigate these decisions.
BioTuring
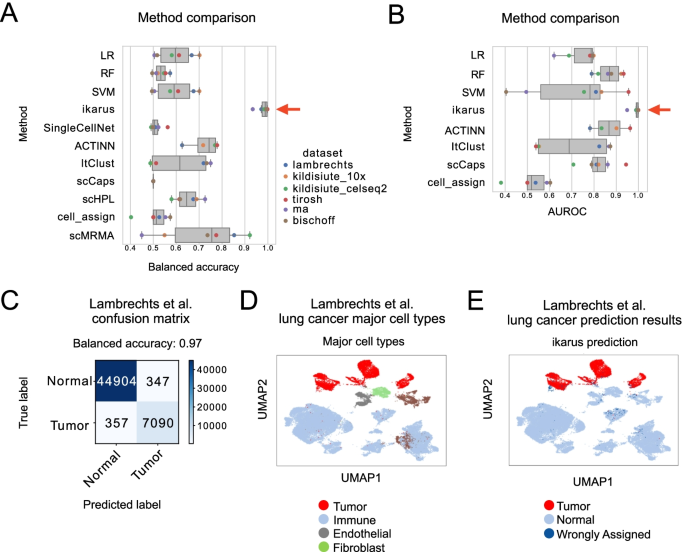
Tumors are complex tissues of cancerous cells surrounded by a heterogeneous cellular microenvironment with which they interact. Single-cell sequencing enables molecular characterization of single cells within the tumor. However, cell annotation—the assignment of cell type or cell state to each sequenced cell—is a challenge, especially identifying tumor cells within single-cell or spatial sequencing experiments.
Here, we propose ikarus, a machine learning pipeline aimed at distinguishing tumor cells from normal cells at the single-cell level. We test ikarus on multiple single-cell datasets, showing that it achieves high sensitivity and specificity in multiple experimental contexts.
**InferCNV** is a Bayesian method, which agglomerates the expression signal of genomically adjointed genes to ascertain whether there is a gain or loss of a certain larger genomic segment. We have used **inferCNV** to call copy number variations in all samples used in the manuscript.
Trends
BioTuring
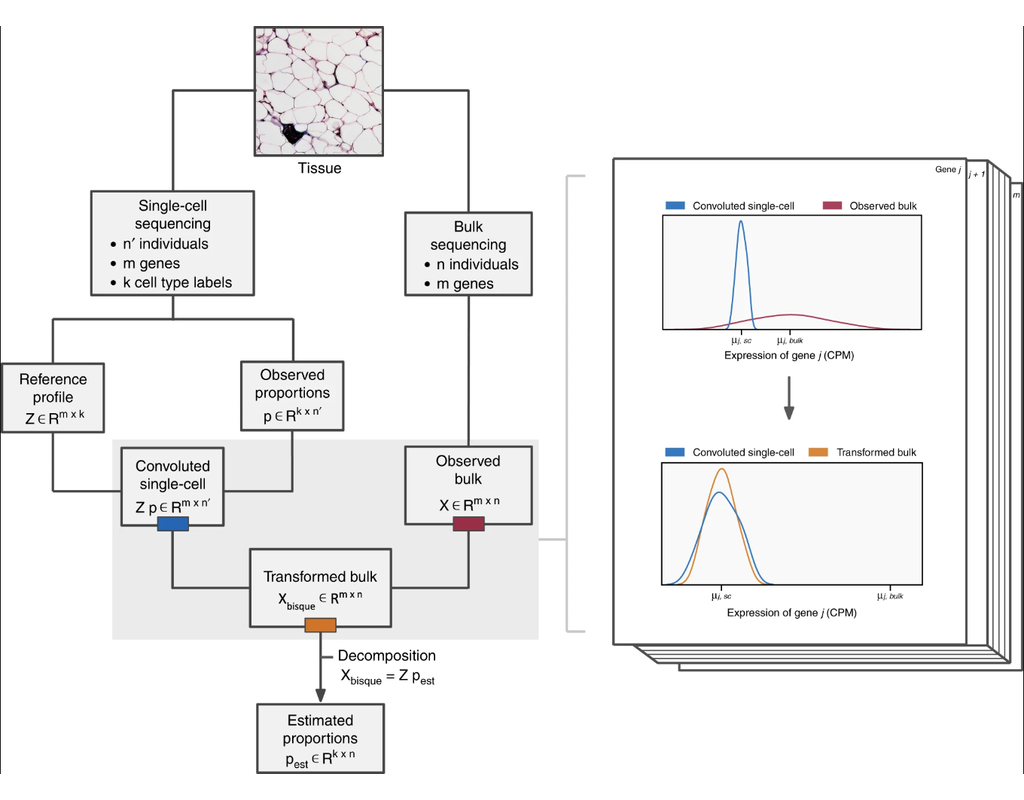
An R toolkit for accurate and efficient estimation of cell composition ('decomposition') from bulk expression data with single-cell information.
Bisque provides two modes of operation:
* Reference-based decomposition: This method utilizes single-cell data to decompose bulk expression. Bisque assumes that both single-cell and bulk counts are measured from the same tissue. Specifically, the cell composition of the labeled single-cell data should match the expected physiological composition. While Bisque doesn't explicitly require matched samples, Bisque expect having samples with both single-cell and bulk expression measured will provide more accurate results.
* Marker-based decomposition: This method utilizes marker genes alone to decompose bulk expression when a reference profile is not available. Single-cell data is not explicitly required but can be used to identify these marker genes. This method captures relative abundances of a cell type across individuals. Note that these abundances are not proportions, so they cannot be compared between different cell types.