


Notebooks

Categories


Cells
Premium


BioTuring
Many spatially resolved transcriptomic technologies do not have single-cell resolution but measure the average gene expression for each spot from a mixture of cells of potentially heterogeneous cell types.
Here, we introduce a deconvolution method, conditional autoregressive-based deconvolution (CARD), that combines cell-type-specific expression information from single-cell RNA sequencing (scRNA-seq) with correlation in cell-type composition across tissue locations. Modeling spatial correlation allows us to borrow the cell-type composition information across locations, improving accuracy of deconvolution even with a mismatched scRNA-seq reference.
**CARD** can also impute cell-type compositions and gene expression levels at unmeasured tissue locations to enable the construction of a refined spatial tissue map with a resolution arbitrarily higher than that measured in the original study and can perform deconvolution without an scRNA-seq reference.
Applications to four datasets, including a pancreatic cancer dataset, identified multiple cell types and molecular markers with distinct spatial localization that define the progression, heterogeneity and compartmentalization of pancreatic cancer.

BioTuring
Single-cell RNA sequencing methods can profile the transcriptomes of single cells but cannot preserve spatial information. Conversely, spatial transcriptomics assays can profile spatial regions in tissue sections but do not have single-cell resolution.
Here, Runmin Wei (Siyuan He, Shanshan Bai, Emi Sei, Min Hu, Alastair Thompson, Ken Chen, Savitri Krishnamurthy & Nicholas E. Navin) developed a computational method called CellTrek that combines these two datasets to achieve single-cell spatial mapping through coembedding and metric learning approaches. They benchmarked CellTrek using simulation and in situ hybridization datasets, which demonstrated its accuracy and robustness.
They then applied CellTrek to existing mouse brain and kidney datasets and showed that CellTrek can detect topological patterns of different cell types and cell states. They performed single-cell RNA sequencing and spatial transcriptomics experiments on two ductal carcinoma in situ tissues and applied CellTrek to identify tumor subclones that were restricted to different ducts, and specific T-cell states adjacent to the tumor areas.

BioTuring
Single-cell RNA sequencing (scRNA-seq) data have allowed us to investigate cellular heterogeneity and the kinetics of a biological process. Some studies need to understand how cells change state, and corresponding genes during the process, but it is challenging to track the cell development in scRNA-seq protocols. Therefore, a variety of statistical and computational methods have been proposed for lineage inference (or pseudotemporal ordering) to reconstruct the states of cells according to the developmental process from the measured snapshot data. Specifically, lineage refers to an ordered transition of cellular states, where individual cells represent points along. pseudotime is a one-dimensional variable representing each cell’s transcriptional progression toward the terminal state.
Slingshot which is one of the methods suggested for lineage reconstruction and pseudotime inference from single-cell gene expression data. In this notebook, we will illustrate an example workflow for cell lineage and pseudotime inference using Slingshot. The notebook is inspired by Slingshot's vignette and modified to demonstrate how the tool works on BioTuring's platform.

BioTuring
Single-cell RNA data allows cell-cell communications (***CCC***) methods to infer CCC at either the individual cell or cell cluster/cell type level, but physical distances between cells are not preserved Almet, Axel A., et al., (2021). On the other hand, spatial data provides spatial distances between cells, but single-cell or gene resolution is potentially lost. Therefore, integrating two types of data in a proper manner can complement their strengths and limitations, from that improve CCC analysis.
In this pipeline, we analyze CCC on Visium data with single-cell data as a reference. The pipeline includes 4 sub-notebooks as following
01-deconvolution: This step involves deconvolution and cell type annotation for Visium data, with cell type information obtained from a relevant single-cell dataset. The deconvolution method is SpatialDWLS which is integrated in Giotto package.
02-giotto: performs spatial based CCC and expression based CCC on Visium data using Giotto method.
03-nichenet: performs spatial based CCC and expression based CCC on Visium data using NicheNet method.
04-visualization: visualizes CCC results obtained from Giotto and NicheNet.
Trends
BioTuring
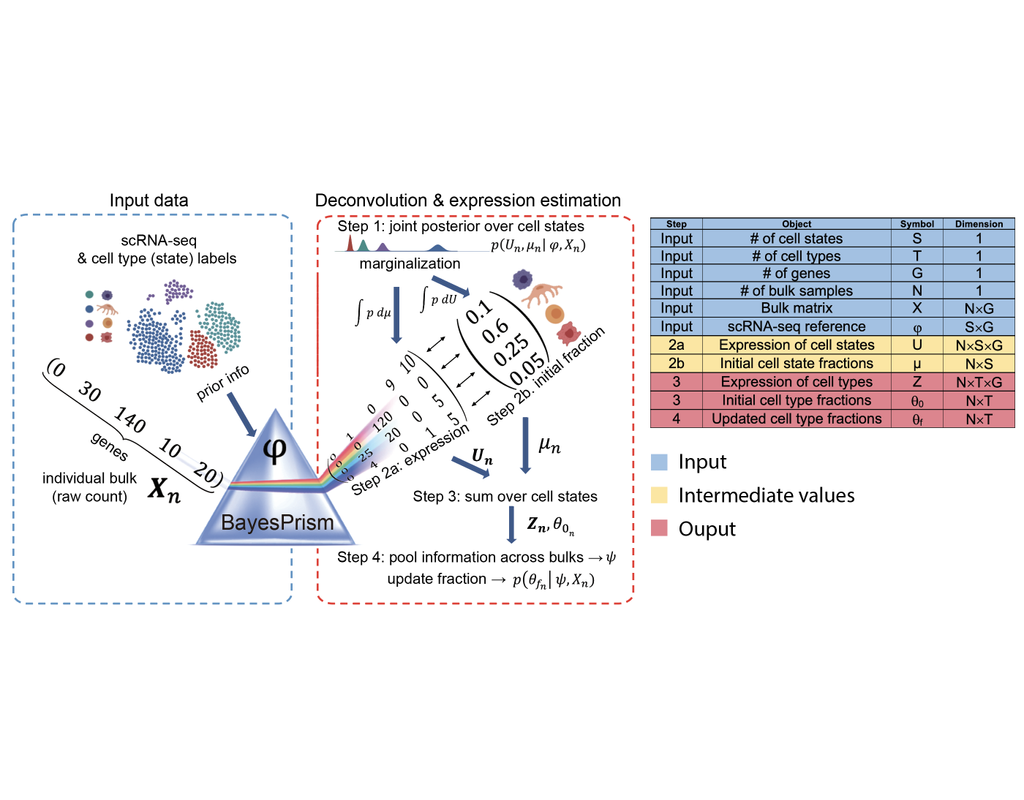
Reconstructing cell type compositions and their gene expression from bulk RNA sequencing (RNA-seq) datasets is an ongoing challenge in cancer research. BayesPrism (Chu, T., Wang, Z., Pe’er, D. et al., 2022) is a Bayesian method used to predict cellular composition and gene expression in individual cell types from bulk RNA-seq datasets, with scRNA-seq as references.
This notebook illustrates an example workflow for bulk RNA-seq deconvolution using BayesPrism. The notebook content is inspired by BayesPrism's vignette and modified to demonstrate how the tool works on BioTuring's platform.