


Notebooks

Categories


Cells
Premium


BioTuring
The development of large-scale single-cell atlases has allowed describing cell states in a more detailed manner. Meanwhile, current deep leanring methods enable rapid analysis of newly generated query datasets by mapping them into reference atlases.
expiMap (‘explainable programmable mapper’) Lotfollahi, Mohammad, et al. is one of the methods proposed for single-cell reference mapping. Furthermore, it incorporates prior knowledge from gene sets databases or users to analyze query data in the context of known gene programs (GPs).

BioTuring
Understanding global communications among cells requires accurate representation of cell-cell signaling links and effective systems-level analyses of those links.
We construct a database of interactions among ligands, receptors and their cofactors that accurately represent known heteromeric molecular complexes. We then develop **CellChat**, a tool that is able to quantitatively infer and analyze intercellular communication networks from single-cell RNA-sequencing (scRNA-seq) data.
CellChat predicts major signaling inputs and outputs for cells and how those cells and signals coordinate for functions using network analysis and pattern recognition approaches. Through manifold learning and quantitative contrasts, CellChat classifies signaling pathways and delineates conserved and context-specific pathways across different datasets.
Applying **CellChat** to mouse and human skin datasets shows its ability to extract complex signaling patterns.
BioTuring
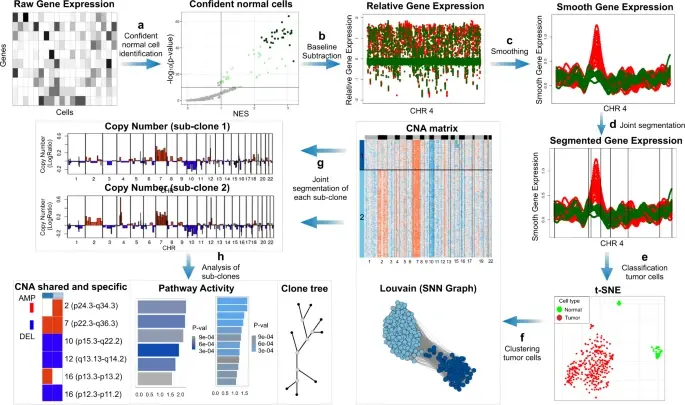
In the realm of cancer research, grasping the intricacies of intratumor heterogeneity and its interplay with the immune system is paramount for deciphering treatment resistance and tumor progression. While single-cell RNA sequencing unveils diverse transcriptional programs, the challenge persists in automatically discerning malignant cells from non-malignant ones within complex datasets featuring varying coverage depths. Thus, there arises a compelling need for an automated solution to this classification conundrum.
SCEVAN (De Falco et al., 2023), a variational algorithm, is designed to autonomously identify the clonal copy number substructure of tumors using single-cell data. It automatically separates malignant cells from non-malignant ones, and subsequently, groups of malignant cells are examined through an optimization-driven joint segmentation process.

BioTuring
Computational methods that model how the gene expression of a cell is influenced by interacting cells are lacking.
We present NicheNet, a method that predicts ligand–target links between interacting cells by combining their expression data with prior knowledge of signaling and gene regulatory networks.
We applied NicheNet to the tumor and immune cell microenvironment data and demonstrated that NicheNet can infer active ligands and their gene regulatory effects on interacting cells.
Trends
BioTuring
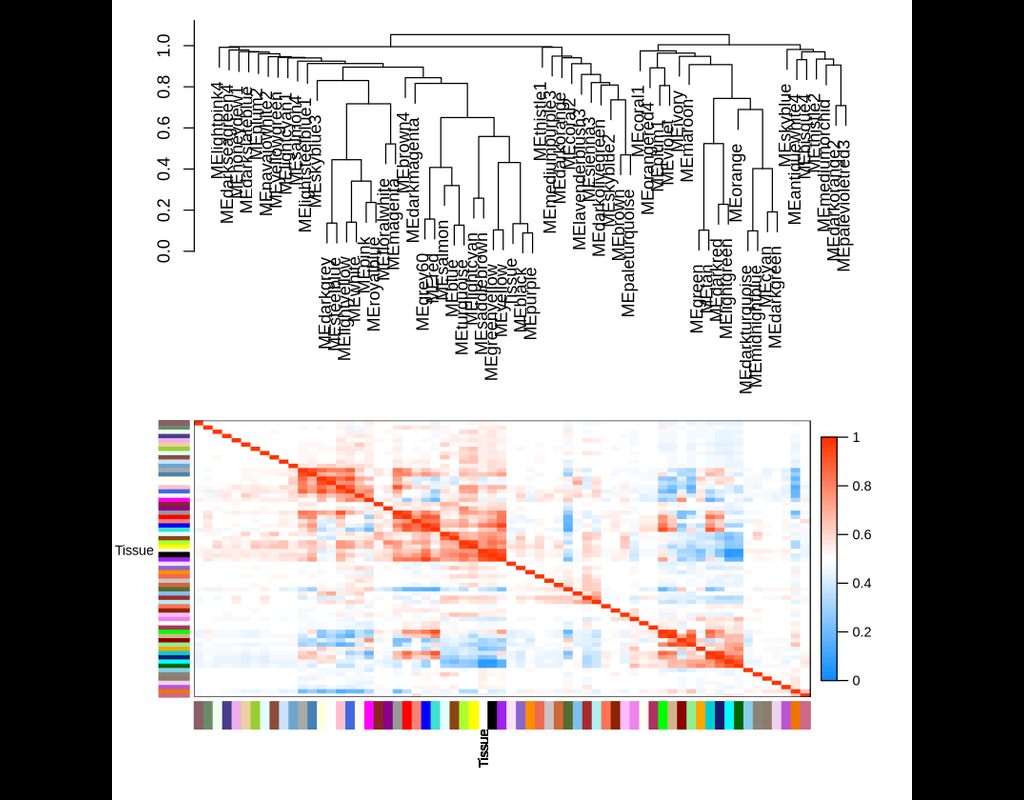
WGCNA: an R package for Weighted Gene Correlation Network Analysis
Correlation networks are increasingly being used in bioinformatics applications. For example, weighted gene co-expression network analysis is a systems biology method for describing the correlation patterns among genes across microarray samples. Weighted correlation network analysis (WGCNA) can be used for:
- Finding clusters (modules) of highly correlated genes
- Summarizing such clusters using the module eigengene or an intramodular hub gene
- Relating modules to one another and to external sample traits (using eigengene network methodology)
- For calculating module membership measures
All of these are important for identifying potential candidate genes associated with measured traits as well as identifying genes that are consistently co-expressed and could be contributing to similar molecular pathways. Using WGCNA is also extremely useful statistically as it accounts for inter-individual variation in gene expression and alleviates issues associated with multiple testing.