


Notebooks

Categories


Cells
Premium


BioTuring
Single-cell RNA sequencing (scRNA-seq) data have allowed us to investigate cellular heterogeneity and the kinetics of a biological process. Some studies need to understand how cells change state, and corresponding genes during the process, but it is challenging to track the cell development in scRNA-seq protocols. Therefore, a variety of statistical and computational methods have been proposed for lineage inference (or pseudotemporal ordering) to reconstruct the states of cells according to the developmental process from the measured snapshot data. Specifically, lineage refers to an ordered transition of cellular states, where individual cells represent points along. pseudotime is a one-dimensional variable representing each cell’s transcriptional progression toward the terminal state.
Slingshot which is one of the methods suggested for lineage reconstruction and pseudotime inference from single-cell gene expression data. In this notebook, we will illustrate an example workflow for cell lineage and pseudotime inference using Slingshot. The notebook is inspired by Slingshot's vignette and modified to demonstrate how the tool works on BioTuring's platform.
BioTuring
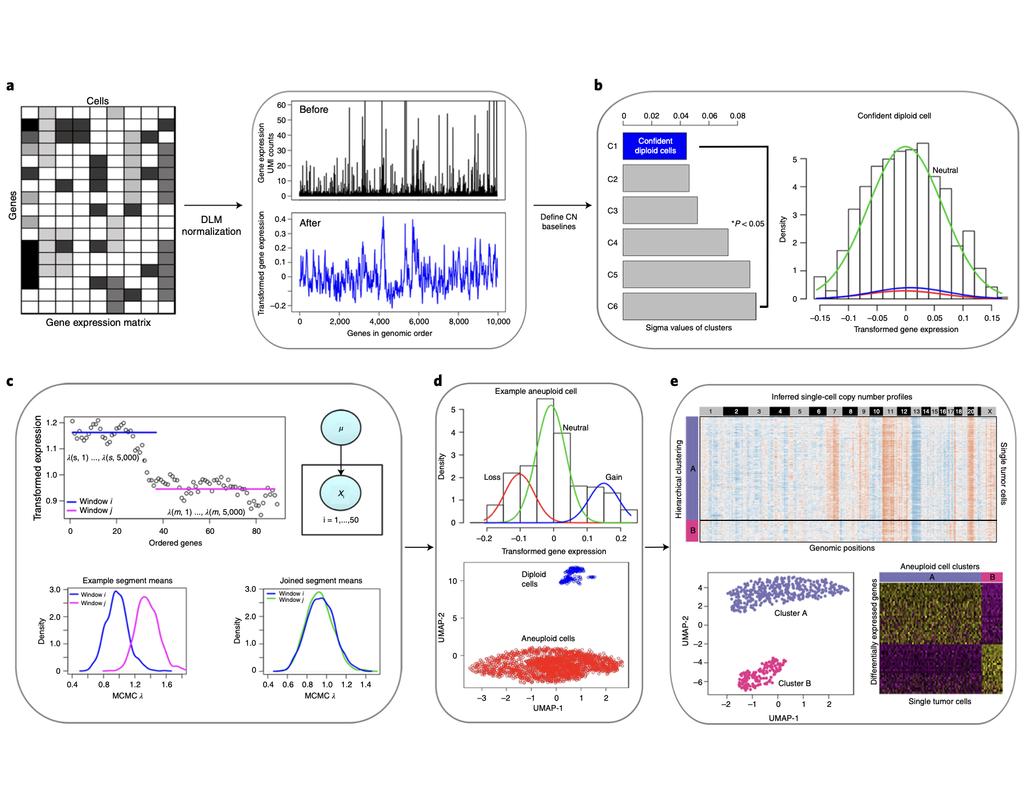
Classification of tumor and normal cells in the tumor microenvironment from scRNA-seq data is an ongoing challenge in human cancer study.
Copy number karyotyping of aneuploid tumors (***copyKAT***) (Gao, Ruli, et al., 2021) is a method proposed for identifying copy number variations in single-cell transcriptomics data. It is used to predict aneuploid tumor cells and delineate the clonal substructure of different subpopulations that coexist within the tumor mass.
In this notebook, we will illustrate a basic workflow of CopyKAT based on the tutorial provided on CopyKAT's repository. We will use a dataset of triple negative cancer tumors sequenced by 10X Chromium 3'-scRNAseq (GSM4476486) as an example. The dataset contains 20,990 features across 1,097 cells. We have modified the notebook to demonstrate how the tool works on BioTuring's platform.

BioTuring
Spatially resolved gene expression profiles are key to understand tissue organization and function. However, spatial transcriptomics (ST) profiling techniques lack single-cell resolution and require a combination with single-cell RNA sequencing (scRNA-seq) information to deconvolute the spatially indexed datasets.
Leveraging the strengths of both data types, we developed SPOTlight, a computational tool that enables the integration of ST with scRNA-seq data to infer the location of cell types and states within a complex tissue. SPOTlight is centered around a seeded non-negative matrix factorization (NMF) regression, initialized using cell-type marker genes and non-negative least squares (NNLS) to subsequently deconvolute ST capture locations (spots).
Simulating varying reference quantities and qualities, we confirmed high prediction accuracy also with shallowly sequenced or small-sized scRNA-seq reference datasets. SPOTlight deconvolution of the mouse brain correctly mapped subtle neuronal cell states of the cortical layers and the defined architecture of the hippocampus. In human pancreatic cancer, we successfully segmented patient sections and further fine-mapped normal and neoplastic cell states.
Trained on an external single-cell pancreatic tumor references, we further charted the localization of clinical-relevant and tumor-specific immune cell states, an illustrative example of its flexible application spectrum and future potential in digital pathology.

BioTuring
Recent technological advancements have enabled spatially resolved transcriptomic profiling but at multi-cellular pixel resolution, thereby hindering the identification of cell-type-specific spatial patterns and gene expression variation.
To address this challenge, we develop STdeconvolve as a reference-free approach to deconvolve underlying cell types comprising such multi-cellular pixel resolution spatial transcriptomics (ST) datasets. Using simulated as well as real ST datasets from diverse spatial transcriptomics technologies comprising a variety of spatial resolutions such as Spatial Transcriptomics, 10X Visium, DBiT-seq, and Slide-seq, we show that STdeconvolve can effectively recover cell-type transcriptional profiles and their proportional representation within pixels without reliance on external single-cell transcriptomics references.
**STdeconvolve** provides comparable performance to existing reference-based methods when suitable single-cell references are available, as well as potentially superior performance when suitable single-cell references are not available.
STdeconvolve is available as an open-source R software package with the source code available at https://github.com/JEFworks-Lab/STdeconvolve .
Trends

BioTuring
Charting an organs’ biological atlas requires us to spatially resolve the entire single-cell transcriptome, and to relate such cellular features to the anatomical scale. Single-cell and single-nucleus RNA-seq (sc/snRNA-seq) can profile cells comprehensively, but lose spatial information.
Spatial transcriptomics allows for spatial measurements, but at lower resolution and with limited sensitivity. Targeted in situ technologies solve both issues, but are limited in gene throughput. To overcome these limitations we present Tangram, a method that aligns sc/snRNA-seq data to various forms of spatial data collected from the same region, including MERFISH, STARmap, smFISH, Spatial Transcriptomics (Visium) and histological images.
**Tangram** can map any type of sc/snRNA-seq data, including multimodal data such as those from SHARE-seq, which we used to reveal spatial patterns of chromatin accessibility. We demonstrate Tangram on healthy mouse brain tissue, by reconstructing a genome-wide anatomically integrated spatial map at single-cell resolution of the visual and somatomotor areas.