


Notebooks

Categories


Cells
Premium


BioTuring
Charting an organs’ biological atlas requires us to spatially resolve the entire single-cell transcriptome, and to relate such cellular features to the anatomical scale. Single-cell and single-nucleus RNA-seq (sc/snRNA-seq) can profile cells comprehensively, but lose spatial information.
Spatial transcriptomics allows for spatial measurements, but at lower resolution and with limited sensitivity. Targeted in situ technologies solve both issues, but are limited in gene throughput. To overcome these limitations we present Tangram, a method that aligns sc/snRNA-seq data to various forms of spatial data collected from the same region, including MERFISH, STARmap, smFISH, Spatial Transcriptomics (Visium) and histological images.
**Tangram** can map any type of sc/snRNA-seq data, including multimodal data such as those from SHARE-seq, which we used to reveal spatial patterns of chromatin accessibility. We demonstrate Tangram on healthy mouse brain tissue, by reconstructing a genome-wide anatomically integrated spatial map at single-cell resolution of the visual and somatomotor areas.

BioTuring
Single-cell RNA-seq datasets in diverse biological and clinical conditions provide great opportunities for the full transcriptional characterization of cell types.
However, the integration of these datasets is challeging as they remain biological and techinical differences. **Harmony** is an algorithm allowing fast, sensitive and accurate single-cell data integration.

BioTuring
Understanding global communications among cells requires accurate representation of cell-cell signaling links and effective systems-level analyses of those links.
We construct a database of interactions among ligands, receptors and their cofactors that accurately represent known heteromeric molecular complexes. We then develop **CellChat**, a tool that is able to quantitatively infer and analyze intercellular communication networks from single-cell RNA-sequencing (scRNA-seq) data.
CellChat predicts major signaling inputs and outputs for cells and how those cells and signals coordinate for functions using network analysis and pattern recognition approaches. Through manifold learning and quantitative contrasts, CellChat classifies signaling pathways and delineates conserved and context-specific pathways across different datasets.
Applying **CellChat** to mouse and human skin datasets shows its ability to extract complex signaling patterns.
BioTuring
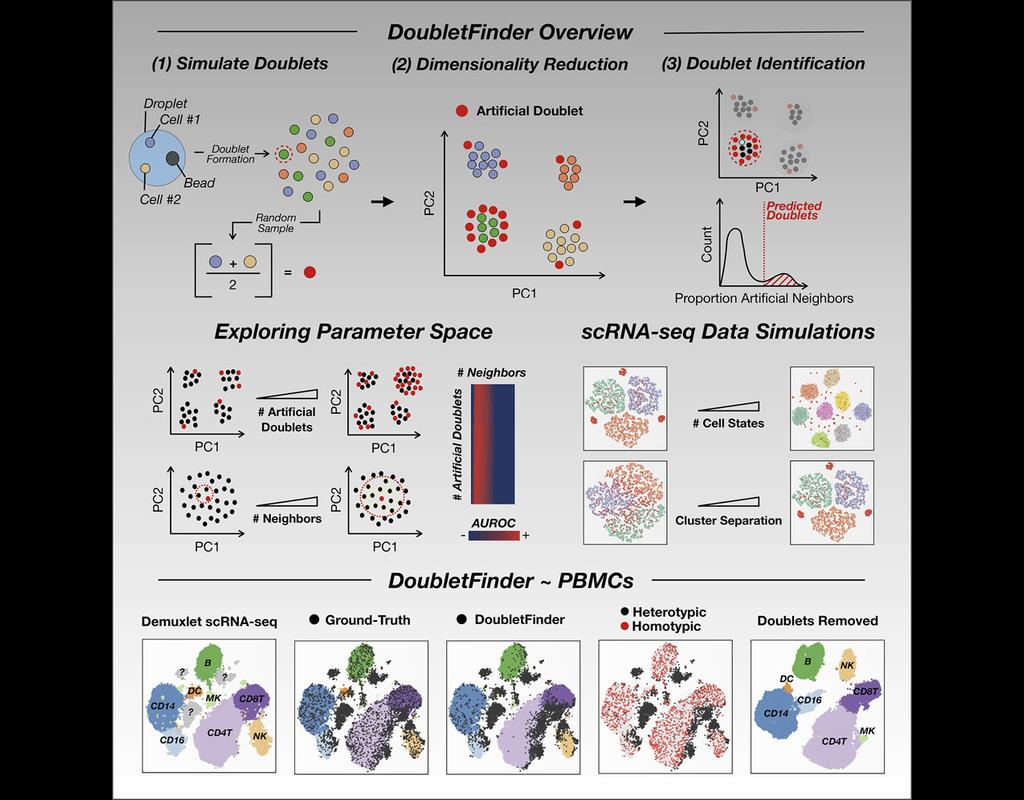
Single-cell RNA sequencing (scRNA-seq) data often encountered technical artifacts called "doublets" which are two cells that are sequenced under the same cellular barcode.
Doublets formed from different cell types or states are called heterotypic and homotypic otherwise. These factors constrain cell throughput and may result in misleading biological interpretations.
DoubletFinder (McGinnis, Murrow, and Gartner 2019) is one of the methods proposed for doublet detection. In this notebook, we will illustrate an example workflow of DoubletFinder. We use a 10x Genomics dataset which captures peripheral blood mononuclear cells (PBMCs) from a healthy donor stained with a panel of 31 TotalSeq™-B antibodies (BioLegend).
Trends
BioTuring
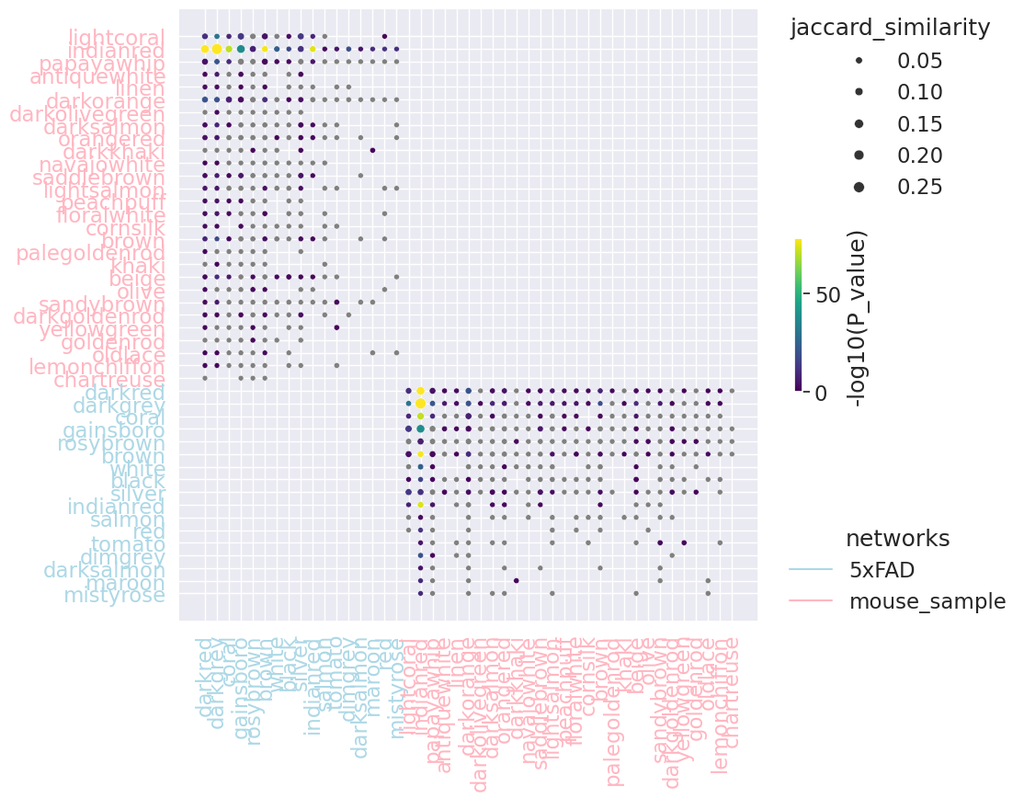
PyWGCNA is a Python library designed to do weighted correlation network analysis (WGCNA). It can be used for:
- Finding clusters (modules) of highly correlated genes
- For summarizing such clusters using the module eigengene
- For relating modules to one another and to external sample traits (using eigengene network methodology)
- For calculating module membership measures.
Users can also compare WGCNA networks from different datasets, or to external gene lists, to assess the conservation or functional enrichment of each module.