


Notebooks

Categories


Cells
Premium


BioTuring
Single-cell RNA sequencing (scRNA-seq) protocols often face challenges in measuring the expression of all genes within a cell due to various factors, such as technical noise, the sensitivity of scRNA-seq techniques, or sample quality. This limitation gives rise to a need for the prediction of unmeasured gene expression values (also known as dropout imputation) from scRNA-seq data.
ADImpute (Leote A, 2023) is an R package combining several dropout imputation methods, including two existing methods (DrImpute, SAVER), two novel implementations: Network, a gene regulatory network-based approach using gene-gene relationships learned from external data, and Baseline, a method corresponding to a sample-wide average..
This notebook is to illustrate an example workflow of ADImpute on sample datasets loaded from the package. The notebook content is inspired from ADImpute's vignette and modified to demonstrate how the tool works on BioTuring's platform.

BioTuring
Cell–cell communication mediated by ligand–receptor complexes is critical to coordinating diverse biological processes, such as development, differentiation and inflammation.
To investigate how the context-dependent crosstalk of different cell types enables physiological processes to proceed, we developed CellPhoneDB, a novel repository of ligands, receptors and their interactions. In contrast to other repositories, our database takes into account the subunit architecture of both ligands and receptors, representing heteromeric complexes accurately.
We integrated our resource with a statistical framework that predicts enriched cellular interactions between two cell types from single-cell transcriptomics data. Here, we outline the structure and content of our repository, provide procedures for inferring cell–cell communication networks from single-cell RNA sequencing data and present a practical step-by-step guide to help implement the protocol.
CellPhoneDB v.2.0 is an updated version of our resource that incorporates additional functionalities to enable users to introduce new interacting molecules and reduces the time and resources needed to interrogate large datasets.
CellPhoneDB v.2.0 is publicly available, both as code and as a user-friendly web interface; it can be used by both experts and researchers with little experience in computational genomics.
In our protocol, we demonstrate how to evaluate meaningful biological interactions with CellPhoneDB v.2.0 using published datasets. This protocol typically takes ~2 h to complete, from installation to statistical analysis and visualization, for a dataset of ~10 GB, 10,000 cells and 19 cell types, and using five threads.

BioTuring
The development of large-scale single-cell atlases has allowed describing cell states in a more detailed manner. Meanwhile, current deep leanring methods enable rapid analysis of newly generated query datasets by mapping them into reference atlases.
expiMap (‘explainable programmable mapper’) Lotfollahi, Mohammad, et al. is one of the methods proposed for single-cell reference mapping. Furthermore, it incorporates prior knowledge from gene sets databases or users to analyze query data in the context of known gene programs (GPs).

BioTuring
Spatially resolved gene expression profiles are key to understand tissue organization and function. However, spatial transcriptomics (ST) profiling techniques lack single-cell resolution and require a combination with single-cell RNA sequencing (scRNA-seq) information to deconvolute the spatially indexed datasets.
Leveraging the strengths of both data types, we developed SPOTlight, a computational tool that enables the integration of ST with scRNA-seq data to infer the location of cell types and states within a complex tissue. SPOTlight is centered around a seeded non-negative matrix factorization (NMF) regression, initialized using cell-type marker genes and non-negative least squares (NNLS) to subsequently deconvolute ST capture locations (spots).
Simulating varying reference quantities and qualities, we confirmed high prediction accuracy also with shallowly sequenced or small-sized scRNA-seq reference datasets. SPOTlight deconvolution of the mouse brain correctly mapped subtle neuronal cell states of the cortical layers and the defined architecture of the hippocampus. In human pancreatic cancer, we successfully segmented patient sections and further fine-mapped normal and neoplastic cell states.
Trained on an external single-cell pancreatic tumor references, we further charted the localization of clinical-relevant and tumor-specific immune cell states, an illustrative example of its flexible application spectrum and future potential in digital pathology.
Trends
BioTuring
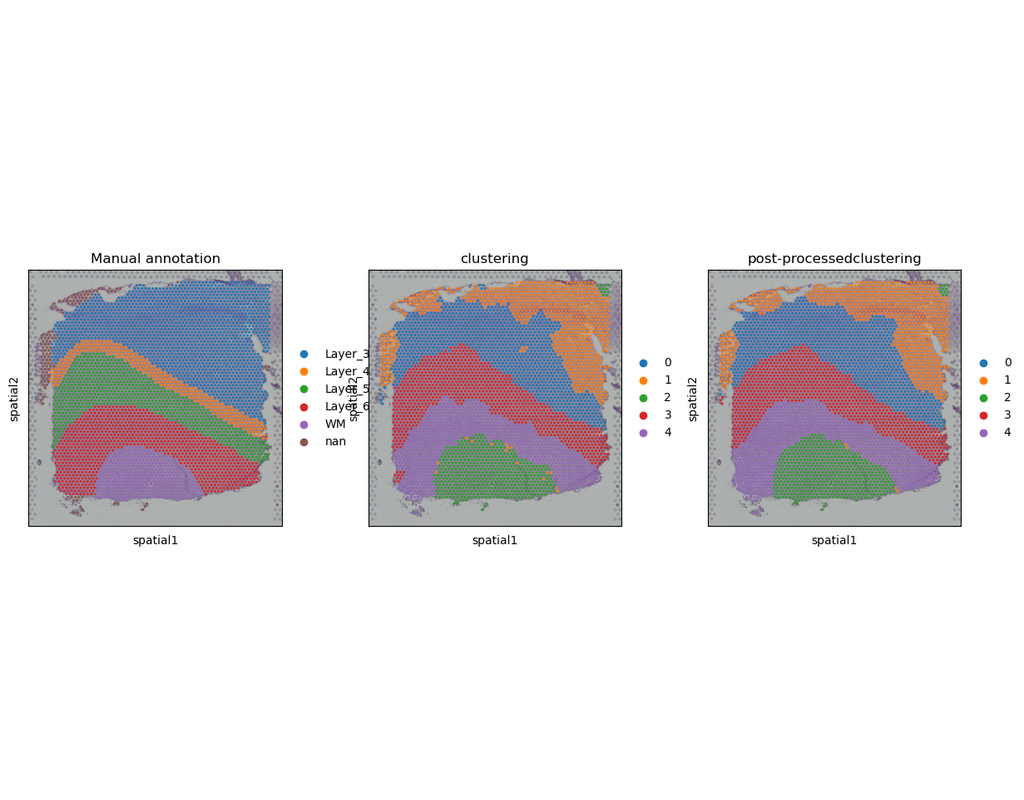
Computational methods have been proposed to leverage spatially resolved transcriptomic data, pinpointing genes with spatial expression patterns and delineating tissue domains. However, existing approaches fall short in uniformly quantifying spatially variable genes (SVGs). Moreover, from a methodological viewpoint, while SVGs are naturally associated with depicting spatial domains, they are technically dissociated in most methods.
Here, PROST is a flexible framework to quantify gene spatial expression patterns and detect spatial tissue domains using spatially resolved transcriptomics with various resolutions. PROST consists of two independent workflows: PROST Index (PI) and PROST Neural Network (PNN).
Using PROST you can do:
* Quantitative identification of spatial patterns of gene expression changes by the proposed PROST Index (PI).
* Unsupervised identification of spatial tissue domains using a PROST Neural Network (PNN) via a self-attention mechanism.