


Notebooks

Categories


Cells
Premium


BioTuring
Expanded CRISPR-compatible CITE-seq (ECCITE-seq) which is built upon pooled CRISPR screens, allows to simultaneously measure transcriptomes, surface protein levels, and single-guide RNA (sgRNA) sequences at single-cell resolution. The technique enables multimodal characterization of each perturbation and effect exploration. However, it also encounters heterogeneity and complexity which can cause substantial noise into downstream analyses.
Mixscape (Papalexi, Efthymia, et al., 2021) is a computational framework proposed to substantially improve the signal-to-noise ratio in single-cell perturbation screens by identifying and removing confounding sources of variation.
In this notebooks, we demonstrate Mixscape's features using pertpy - a Python package offering a range of tools for perturbation analysis. The original pipeline of Mixscape implemented in R can be found here.
BioTuring
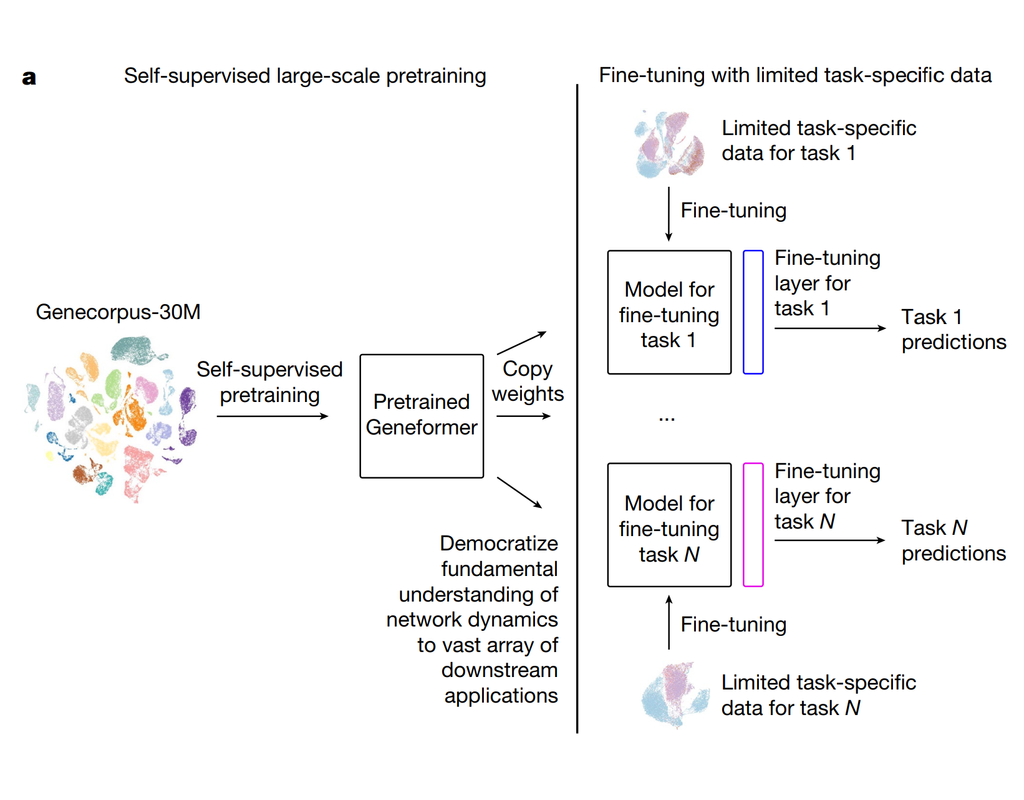
Geneformer is a foundation transformer model pretrained on a large-scale corpus of ~30 million single cell transcriptomes to enable context-aware predictions in settings with limited data in network biology. Here, we will demonstrate a basic workflow to work with ***Geneformer*** models.
These notebooks include the instruction to:
1. Prepare input datasets
2. Finetune Geneformer model to perform specific task
3. Using finetuning models for cell classification and gene classification application

BioTuring
In this notebook, we present COMMOT (COMMunication analysis by Optimal Transport) to infer cell-cell communication (CCC) in spatial transcriptomic, a package that infers CCC by simultaneously considering numerous ligand–receptor pairs for either spatial transcriptomic data or spatially annotated scRNA-seq data equipped with spatial distances between cells estimated from paired spatial imaging data.
A collective optimal transport method is developed to handle complex molecular interactions and spatial constraints. Furthermore, we introduce downstream analysis tools to infer spatial signaling directionality and genes regulated by signaling using machine learning models.

BioTuring
Understanding global communications among cells requires accurate representation of cell-cell signaling links and effective systems-level analyses of those links.
We construct a database of interactions among ligands, receptors and their cofactors that accurately represent known heteromeric molecular complexes. We then develop **CellChat**, a tool that is able to quantitatively infer and analyze intercellular communication networks from single-cell RNA-sequencing (scRNA-seq) data.
CellChat predicts major signaling inputs and outputs for cells and how those cells and signals coordinate for functions using network analysis and pattern recognition approaches. Through manifold learning and quantitative contrasts, CellChat classifies signaling pathways and delineates conserved and context-specific pathways across different datasets.
Applying **CellChat** to mouse and human skin datasets shows its ability to extract complex signaling patterns.
Trends
BioTuring
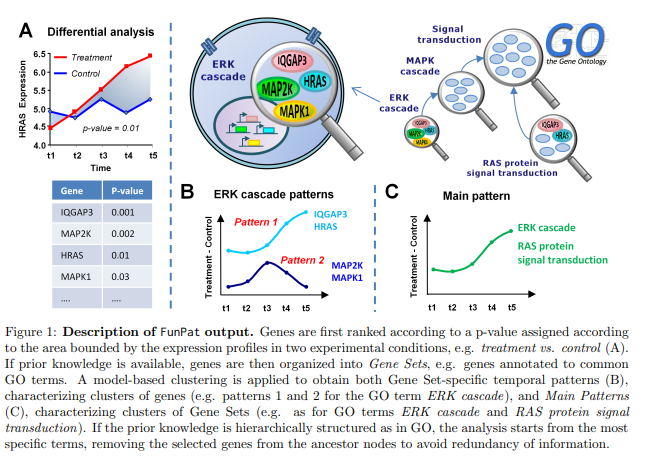
Dynamic expression data, nowadays obtained using high-throughput RNA sequencing (RNA-seq), are essential to monitor transient gene expression changes and to study the dynamics of their transcriptional activity in the cell or response to stimuli. FunPat is an R package designed to provide:
- a useful tool to analyze time series genomic data;
- a computational pipeline which integrates gene selection, clustering and functional annotations into a single framework to identify the main temporal patterns associated to functional groups of differentially expressed (DE) genes;
- an easy way to exploit different types of annotations from currently available databases (e.g. Gene Ontology) to extract the most meaningful information characterizing the main expression dynamics;
- a user-friendly organization and visualization of the outcome, automatically linking the DE genes and their temporal patterns to the functional information for an easy biological interpretation of the results.