


Notebooks

Categories


Cells
Premium


BioTuring
The recent development of experimental methods for measuring chromatin state at single-cell resolution has created a need for computational tools capable of analyzing these datasets. Here we developed Signac, a framework for the analysis of single-cell chromatin data, as an extension of the Seurat R toolkit for single-cell multimodal analysis.
**Signac** enables an end-to-end analysis of single-cell chromatin data, including peak calling, quantification, quality control, dimension reduction, clustering, integration with single-cell gene expression datasets, DNA motif analysis, and interactive visualization.
Furthermore, Signac facilitates the analysis of multimodal single-cell chromatin data, including datasets that co-assay DNA accessibility with gene expression, protein abundance, and mitochondrial genotype. We demonstrate scaling of the Signac framework to datasets containing over 700,000 cells.
BioTuring
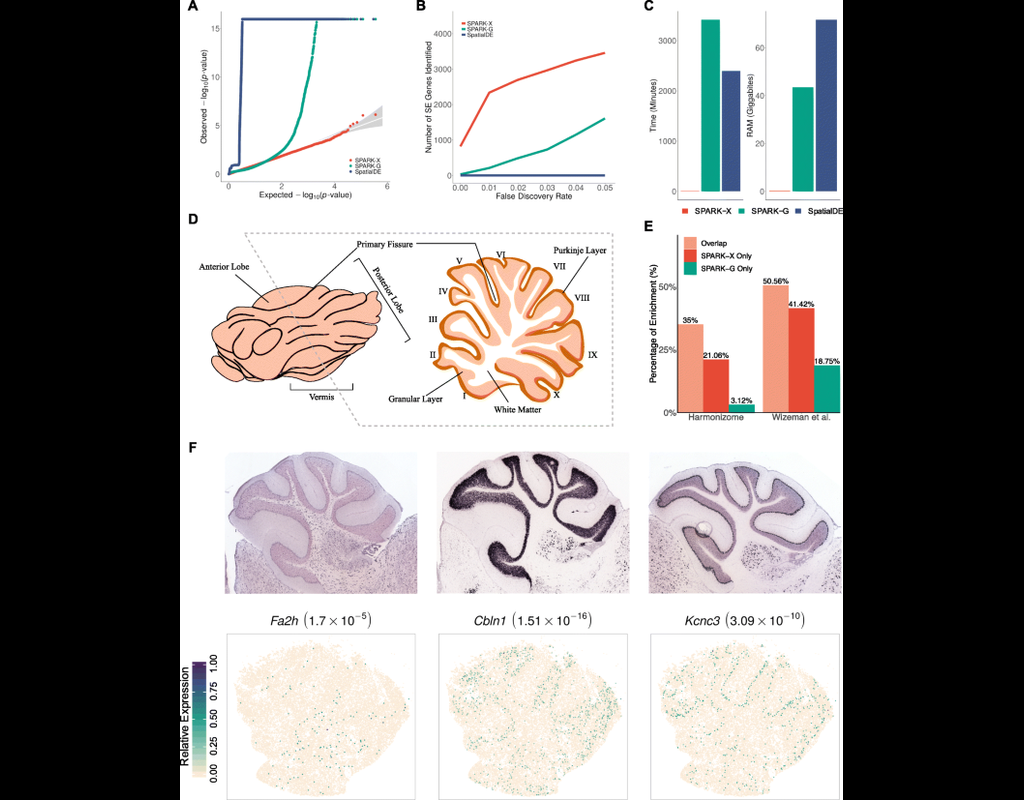
Spatial transcriptomic studies are becoming increasingly common and large, posing important statistical and computational challenges for many analytic tasks. Here, we present SPARK-X, a non-parametric method for rapid and effective detection of spatially expressed genes in large spatial transcriptomic studies.
SPARK-X not only produces effective type I error control and high power but also brings orders of magnitude computational savings. We apply SPARK-X to analyze three large datasets, one of which is only analyzable by SPARK-X. In these data, SPARK-X identifies many spatially expressed genes including those that are spatially expressed within the same cell type, revealing new biological insights.

BioTuring
Power analyses are considered important factors in designing high-quality experiments. However, such analyses remain a challenge in single-cell RNA-seq studies due to the presence of hierarchical structure within the data (Zimmerman et al., 2021). As cells sampled from the same individual share genetic and environmental backgrounds, these cells are more correlated than cells sampled from different individuals. Currently, most power analyses and hypothesis tests (e.g., differential expression) in scRNA-seq data treat cells as if they were independent, thus ignoring the intra-sample correlation, which could lead to incorrect inferences.
Hierarchicell (Zimmerman, K.D. and Langefeld, C.D., 2021) is an R package proposed to estimate power for testing hypotheses of differential expression in scRNA-seq data while considering the hierarchical correlation structure that exists in the data. The method offers four important categories of functions: data loading and cleaning, empirical estimation of distributions, simulating expression data, and computing type 1 error or power.
In this notebook, we will illustrate an example workflow of Hierarchicell. The notebook is inspired by Hierarchicell's vignette and modified to demonstrate how the tool works on BioTuring's platform.

BioTuring
Single-cell RNA data allows cell-cell communications (***CCC***) methods to infer CCC at either the individual cell or cell cluster/cell type level, but physical distances between cells are not preserved Almet, Axel A., et al., (2021). On the other hand, spatial data provides spatial distances between cells, but single-cell or gene resolution is potentially lost. Therefore, integrating two types of data in a proper manner can complement their strengths and limitations, from that improve CCC analysis.
In this pipeline, we analyze CCC on Visium data with single-cell data as a reference. The pipeline includes 4 sub-notebooks as following
01-deconvolution: This step involves deconvolution and cell type annotation for Visium data, with cell type information obtained from a relevant single-cell dataset. The deconvolution method is SpatialDWLS which is integrated in Giotto package.
02-giotto: performs spatial based CCC and expression based CCC on Visium data using Giotto method.
03-nichenet: performs spatial based CCC and expression based CCC on Visium data using NicheNet method.
04-visualization: visualizes CCC results obtained from Giotto and NicheNet.
Trends

BioTuring
In this notebook, we present COMMOT (COMMunication analysis by Optimal Transport) to infer cell-cell communication (CCC) in spatial transcriptomic, a package that infers CCC by simultaneously considering numerous ligand–receptor pairs for either spatial transcriptomic data or spatially annotated scRNA-seq data equipped with spatial distances between cells estimated from paired spatial imaging data.
A collective optimal transport method is developed to handle complex molecular interactions and spatial constraints. Furthermore, we introduce downstream analysis tools to infer spatial signaling directionality and genes regulated by signaling using machine learning models.