


Notebooks

Categories


Cells
Premium


BioTuring
The recent development of experimental methods for measuring chromatin state at single-cell resolution has created a need for computational tools capable of analyzing these datasets. Here we developed Signac, a framework for the analysis of single-cell chromatin data, as an extension of the Seurat R toolkit for single-cell multimodal analysis.
**Signac** enables an end-to-end analysis of single-cell chromatin data, including peak calling, quantification, quality control, dimension reduction, clustering, integration with single-cell gene expression datasets, DNA motif analysis, and interactive visualization.
Furthermore, Signac facilitates the analysis of multimodal single-cell chromatin data, including datasets that co-assay DNA accessibility with gene expression, protein abundance, and mitochondrial genotype. We demonstrate scaling of the Signac framework to datasets containing over 700,000 cells.

BioTuring
Spatially resolved gene expression profiles are key to understand tissue organization and function. However, spatial transcriptomics (ST) profiling techniques lack single-cell resolution and require a combination with single-cell RNA sequencing (scRNA-seq) information to deconvolute the spatially indexed datasets.
Leveraging the strengths of both data types, we developed SPOTlight, a computational tool that enables the integration of ST with scRNA-seq data to infer the location of cell types and states within a complex tissue. SPOTlight is centered around a seeded non-negative matrix factorization (NMF) regression, initialized using cell-type marker genes and non-negative least squares (NNLS) to subsequently deconvolute ST capture locations (spots).
Simulating varying reference quantities and qualities, we confirmed high prediction accuracy also with shallowly sequenced or small-sized scRNA-seq reference datasets. SPOTlight deconvolution of the mouse brain correctly mapped subtle neuronal cell states of the cortical layers and the defined architecture of the hippocampus. In human pancreatic cancer, we successfully segmented patient sections and further fine-mapped normal and neoplastic cell states.
Trained on an external single-cell pancreatic tumor references, we further charted the localization of clinical-relevant and tumor-specific immune cell states, an illustrative example of its flexible application spectrum and future potential in digital pathology.

BioTuring
Charting an organs’ biological atlas requires us to spatially resolve the entire single-cell transcriptome, and to relate such cellular features to the anatomical scale. Single-cell and single-nucleus RNA-seq (sc/snRNA-seq) can profile cells comprehensively, but lose spatial information.
Spatial transcriptomics allows for spatial measurements, but at lower resolution and with limited sensitivity. Targeted in situ technologies solve both issues, but are limited in gene throughput. To overcome these limitations we present Tangram, a method that aligns sc/snRNA-seq data to various forms of spatial data collected from the same region, including MERFISH, STARmap, smFISH, Spatial Transcriptomics (Visium) and histological images.
**Tangram** can map any type of sc/snRNA-seq data, including multimodal data such as those from SHARE-seq, which we used to reveal spatial patterns of chromatin accessibility. We demonstrate Tangram on healthy mouse brain tissue, by reconstructing a genome-wide anatomically integrated spatial map at single-cell resolution of the visual and somatomotor areas.

BioTuring
Mapping out the coarse-grained connectivity structures of complex manifolds
Biological systems often change over time, as old cells die and new cells are created through differentiation from progenitor cells. This means that at any given time, not all cells will be at the same stage of development. In this sense, a single-cell sample could contain cells at different stages of differentiation. By analyzing the data, we can identify which cells are at which stages and build a model for their biological transitions.
By quantifying the connectivity of partitions (groups, clusters) of the single-cell graph, partition-based graph abstraction (PAGA) generates a much simpler abstracted graph (PAGA graph) of partitions, in which edge weights represent confidence in the presence of connections.
In this notebook, we will introduce the concept of single-cell Trajectory Analysis using PAGA (Partition-based graph abstraction) in the context of hematopoietic differentiation.
Trends
BioTuring
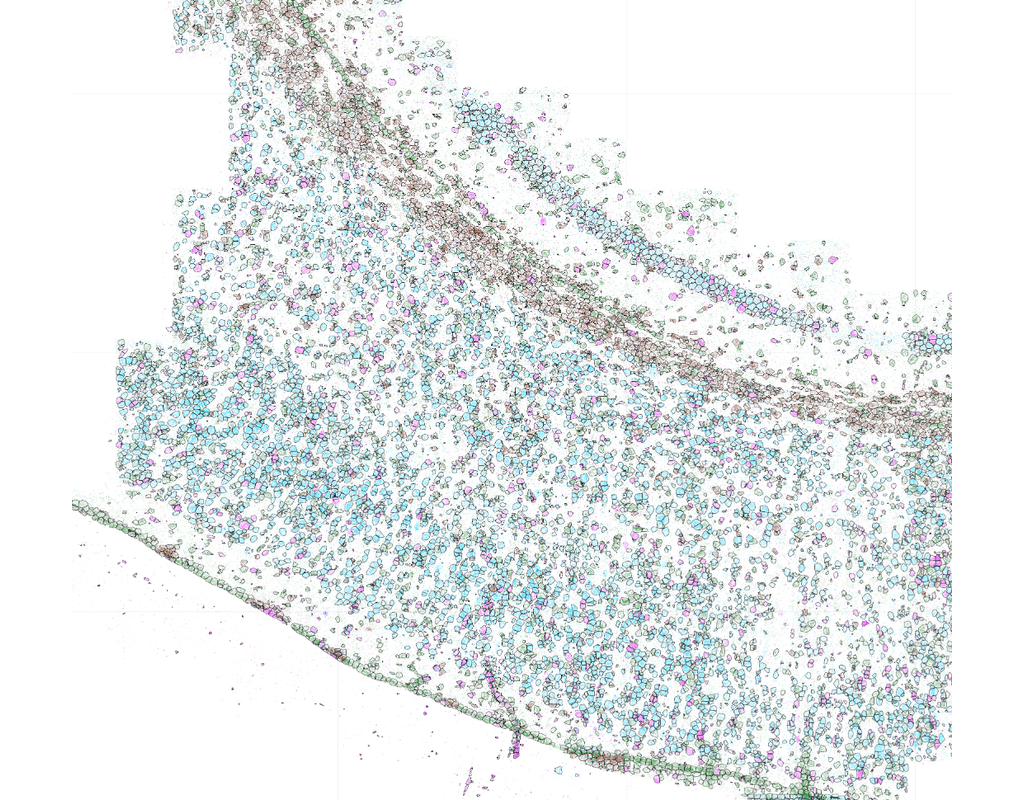
Single-molecule spatial transcriptomics protocols based on in situ sequencing or multiplexed RNA fluorescent hybridization can reveal detailed tissue organization. However, distinguishing the boundaries of individual cells in such data is challenging and can hamper downstream analysis.
Baysor is a tool for performing cell segmentation on imaging-based spatial transcriptomics data. It optimizes two-dimensional (2D) or three-dimensional (3D) cell boundaries segmentation considering the likelihood of transcriptional composition, size and shape of the cell (cell morphology). The approach can take into account nuclear or cytoplasm staining, however, can also perform segmentation based on the detected molecules alone.