
BioStudio is the complete analytics platform that empowers scientists to expand their research horizons without technical complexities.
Learn how you can scale to meet volume demand, grow your portfolio and expand your global reach. Accelerate your workflows with a seamlessly integrated computational infrastructure, processing and analyzing massive datasets in a few hours versus days.
support@bioturing.com
4445 Eastgate Mall, Suite 200, San Diego, California 92121, USA.
+1-858-436-4073


Explore latest methods with

BioStudio continually refreshes curated notebooks and packages with the latest methods. Clear instructions and result interpretations provided. Our team promptly caters to your specific needs.
Accelerate your single-cell research with
With the most efficient GPU-accelerated single-cell data analysis pipeline from BioTuring, you can now analyze multi-million-cell datasets in seconds.

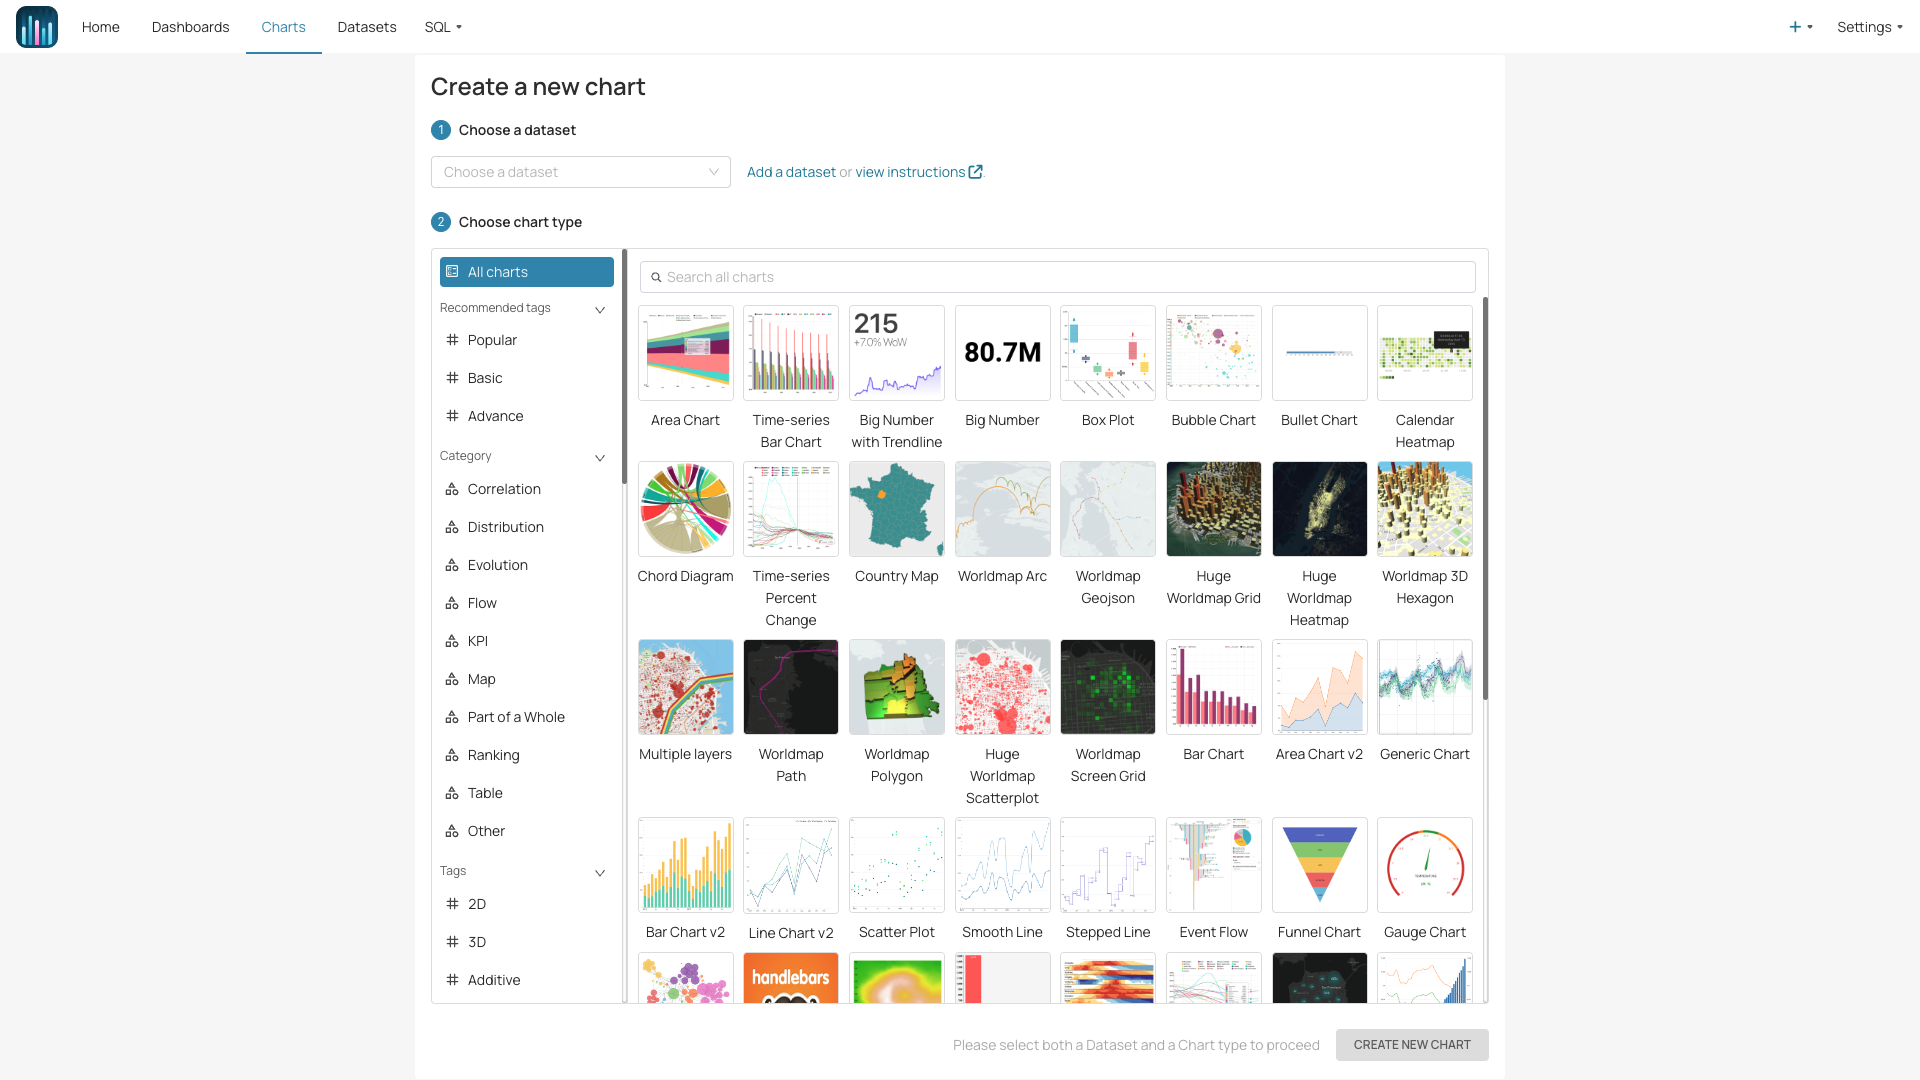
Draw your insights freely with
Researchers can swiftly employ cutting-edge machine learning methods on their data and skillfully visualize outcomes for valuable insights.
Advance your research with
We select and train numerous models on curated data from our comprehensive database for various advanced analysis purposes.

BioStudio Visualization opens an entire new category of graphical functions that I was, prior to this software, incapable of doing.
Subscribe to be among the first to get a sneak peek into BioStudio’s initiatives and updates

 Recent


